11 Nitrogen cycle
Nitrogen (N) is needed for the synthesis of biomass and is thus essential for life and for sustaining the carbon cycle. N is abundant in the atmosphere, however it is present mostly as molecular nitrogen, N2, whereas organisms generally require reactive nitrogen, Nr, to build biomass and sustain vital functions. Converting N2 into these usable forms requires specialised biological or physical processes. Nitrogen can therefore be scarce for organisms despite them being surrounded by a vast atmospheric reservoir.
Under natural conditions, new inputs of reactive N to terrestrial ecosystems are small compared with the amount of N used each year in terrestrial primary production. Most of this demand is met by recycling: plants recover N from senescing tissues and by renewed uptake of mineralised dead organic matter. Only a relatively small fraction of N enters the terrestrial cycling through biological fixation and deposition of reactive N species.
Human activities have greatly increased new Nr inputs into the terrestrial biosphere through industrial fixation, cultivation of N-fixing crops, and combustion of biomass. This perturbation has increased N pollution and emissions of the greenhouse gas N2O, while additional Nr inputs have enabled the rapid growth in crop yields and may have contributed to the sustained C sink in the terrestrial biosphere (Vries et al. 2009). The chapter first introduces N species, reservoirs, transformations, and the (re-)cycling of N in terrestrial ecosystems. Then, an overview of global budgets and interactions with the C cycle is given.
11.1 Earth-level perspective
11.1.1 Reservoirs
About half of all N on Earth is present as N2 gas in the atmosphere, while the other half is contained in the Earth’s mantle and crust. The cycling between these compartments is extremely slow at a turnover time of about 1 biollion years (Canfield, Glazer, and Falkowski 2010b).
| Reservoir and form | Stock (Tg N) | Scope and source |
|---|---|---|
| Atmospheric N2 | \(4\times10^9\) | Global atmosphere (Johnson and Goldblatt 2015) |
| Ocean dissolved N2 | \(2.4\times10^7\) | Global ocean; approximate inventory (Johnson and Goldblatt 2015) |
| Ocean nitrate | \(5.9\times10^5\) | World Ocean Atlas inventory, 0–5500 m (Garcia et al. 2024) |
| Ocean dissolved organic N | \(7.7\times10^4\) | Approximate inventory, uncertainty about ±30% (Gruber 2008) |
| Ocean particulate organic N | \(4\times10^2\) | Living and detrital particles; uncertainty about ±50% (Gruber 2008) |
| Soil total N, predominantly organic | \(1.4\times10^5\) | Upper 1 m; global soil inventory (Niels H. Batjes 1996) |
| Live terrestrial vegetation | \(3.8\times10^3\) | Approximate global stock (Schulze et al. 2019; William H. Schlesinger and Emily S. Bernhardt 2013) |
| Soil ammonium + nitrate | \(9.4\times10^2\) | Model estimate for natural vegetation, soil depth 1.5 m (Xu-Ri and Prentice 2008) |
11.1.1.1 Atmosphere
About 78% of dry air by volume consists of N2. The atmospheric stock is about \(4\times10^{9}\) Tg N. This is an enormous reservoir compared with the N in vegetation (3.8 Pg N) and soils (95-140 Pg N) (Schulze et al. 2019; William H. Schlesinger and Emily S. Bernhardt 2013). Comparing the atmospheric N stock with the rate of removal by terrestrial and oceanic N fixation (0.11 Pg N yr-1 for terrestrial and 0.14 Pg N yr-1 for oceanic N fixation, Gruber and Galloway (2008)) yields a turnover rate of 16 mio. years.
A set of further N-containing molecules are contained in the atmosphere (Table 11.2), but at much lower concentrations. Yet, they have important roles as agents in atmospheric chemical transformations, including aerosol production and ozone depletion. In addition, N2O is a strong greenhouse gas (Chapter 12). In view of their role in atmospheric chemical transformations, as well as biological processes (Section 11.2), these species are referred to as reactive nitrogen (Nr).
The ultimate reason for the strong dominance of N present as N2 vs Nr is the strong triple bond in N2, which presents an energetic barrier to its conversion and implies a tendency of chemical reactions to convert Nr back to N2 in view of its lower chemical energetic state.
| Formula | Name | Atmospheric grouping or role |
|---|---|---|
| N2 | Molecular nitrogen, or dinitrogen | Outside Nr |
| NH3 | Ammonia | NHx; gas |
| NH4+ | Ammonium | NHx; dissolved or particle-bound |
| NO | Nitric oxide | NOx and NOy |
| NO2 | Nitrogen dioxide | NOx and NOy |
| HNO3 | Nitric acid | NOy |
| NO3- | Nitrate | NOy when in atmospheric particles or droplets |
| NO2- | Nitrite | Important aqueous/soil intermediate; distinct from NO2 gas |
| N2O | Nitrous oxide | Treated separately from NOy |
11.1.1.2 Ocean
The ocean contains dissolved N2, dissolved inorganic reactive N, dissolved organic N, and N in organisms and sinking particles. Molecular N2, around 24,000 Pg N (Johnson and Goldblatt 2015) is the dominant oceanic N species by mass. Nitrate is a major reservoir of biologically available N below the sunlit surface (around 590 Pg N (Garcia et al. 2024)). Other N species in the ocean make up a much smaller portion of the total inventory.
11.1.1.3 Soils and vegetation
Most N in the terrestrial biosphere is organic N in dead and living material, with soil organic matter dominating the stock (95-140 Pg N), compared to around 3.8 Pg N in live vegetation (Schulze et al. 2019; William H. Schlesinger and Emily S. Bernhardt 2013; N. H. Batjes 2016). Plants use N in nucleic acids and proteins, including enzymes and structural proteins. Cellulose and lignin themselves contain no N. Soil microorganisms and animals also contain N, but much soil organic N is in microbial residues and other non-living material. These stocks must be distinguished from the small pool of inorganic N species contained in the soil, which rapidly turn over and are the principal supply for plant uptake (Section 11.2.4).
A model-based quantitative example is the global natural-vegetation simulation of Xu-Ri and Prentice (2008). This model simulation produced 5.3 Pg N in vegetation, 4.6 Pg N in litter, 56.8 Pg N in soil organic matter down to 1.5 m, and 0.94 Pg N in inorganic soil pools – the sum of ammonium and nitrate. This illustrates the dominance of organic N over inorganic N in the soil.
11.1.1.4 Lithosphere and the deeper Earth
Nitrogen also resides in sediments and rocks, as organic N and as ammonium incorporated in minerals. Burial transfers biologically fixed N into sediments. Metamorphism, weathering, subduction, and volcanic degassing redistribute N over geological time. The mantle and core are additional deep-Earth reservoirs, beyond the lithosphere. Their inventories are uncertain, but estimates indicate that the solid Earth contains similar (Canfield, Glazer, and Falkowski 2010a), or about 7 times more N than the atmosphere (Johnson and Goldblatt 2015). Most of this N is inaccessible on ecological timescales. The smaller flux released by weathering of N-bearing rocks can nevertheless matter locally (Houlton, Morford, and Dahlgren 2018b).
11.1.2 Global flows
Biological fixation dominates natural production of Nr on land and in the ocean. Lightning supplies a smaller flux directly to the atmosphere. Denitrification and related microbial pathways return fixed N to N2, while nitrification and denitrification also supply atmospheric N2O – a strong greenhouse gas (Chapter 12). Rivers connect terrestrial and marine reservoirs, and sediment burial removes N from active ocean cycling. Figure 11.1 summarises magnitudes, including the anthropogenic perturbation at present-day, which are further introduced in Section 11.3. Terrestrial mechanisms are described in Section 11.2.
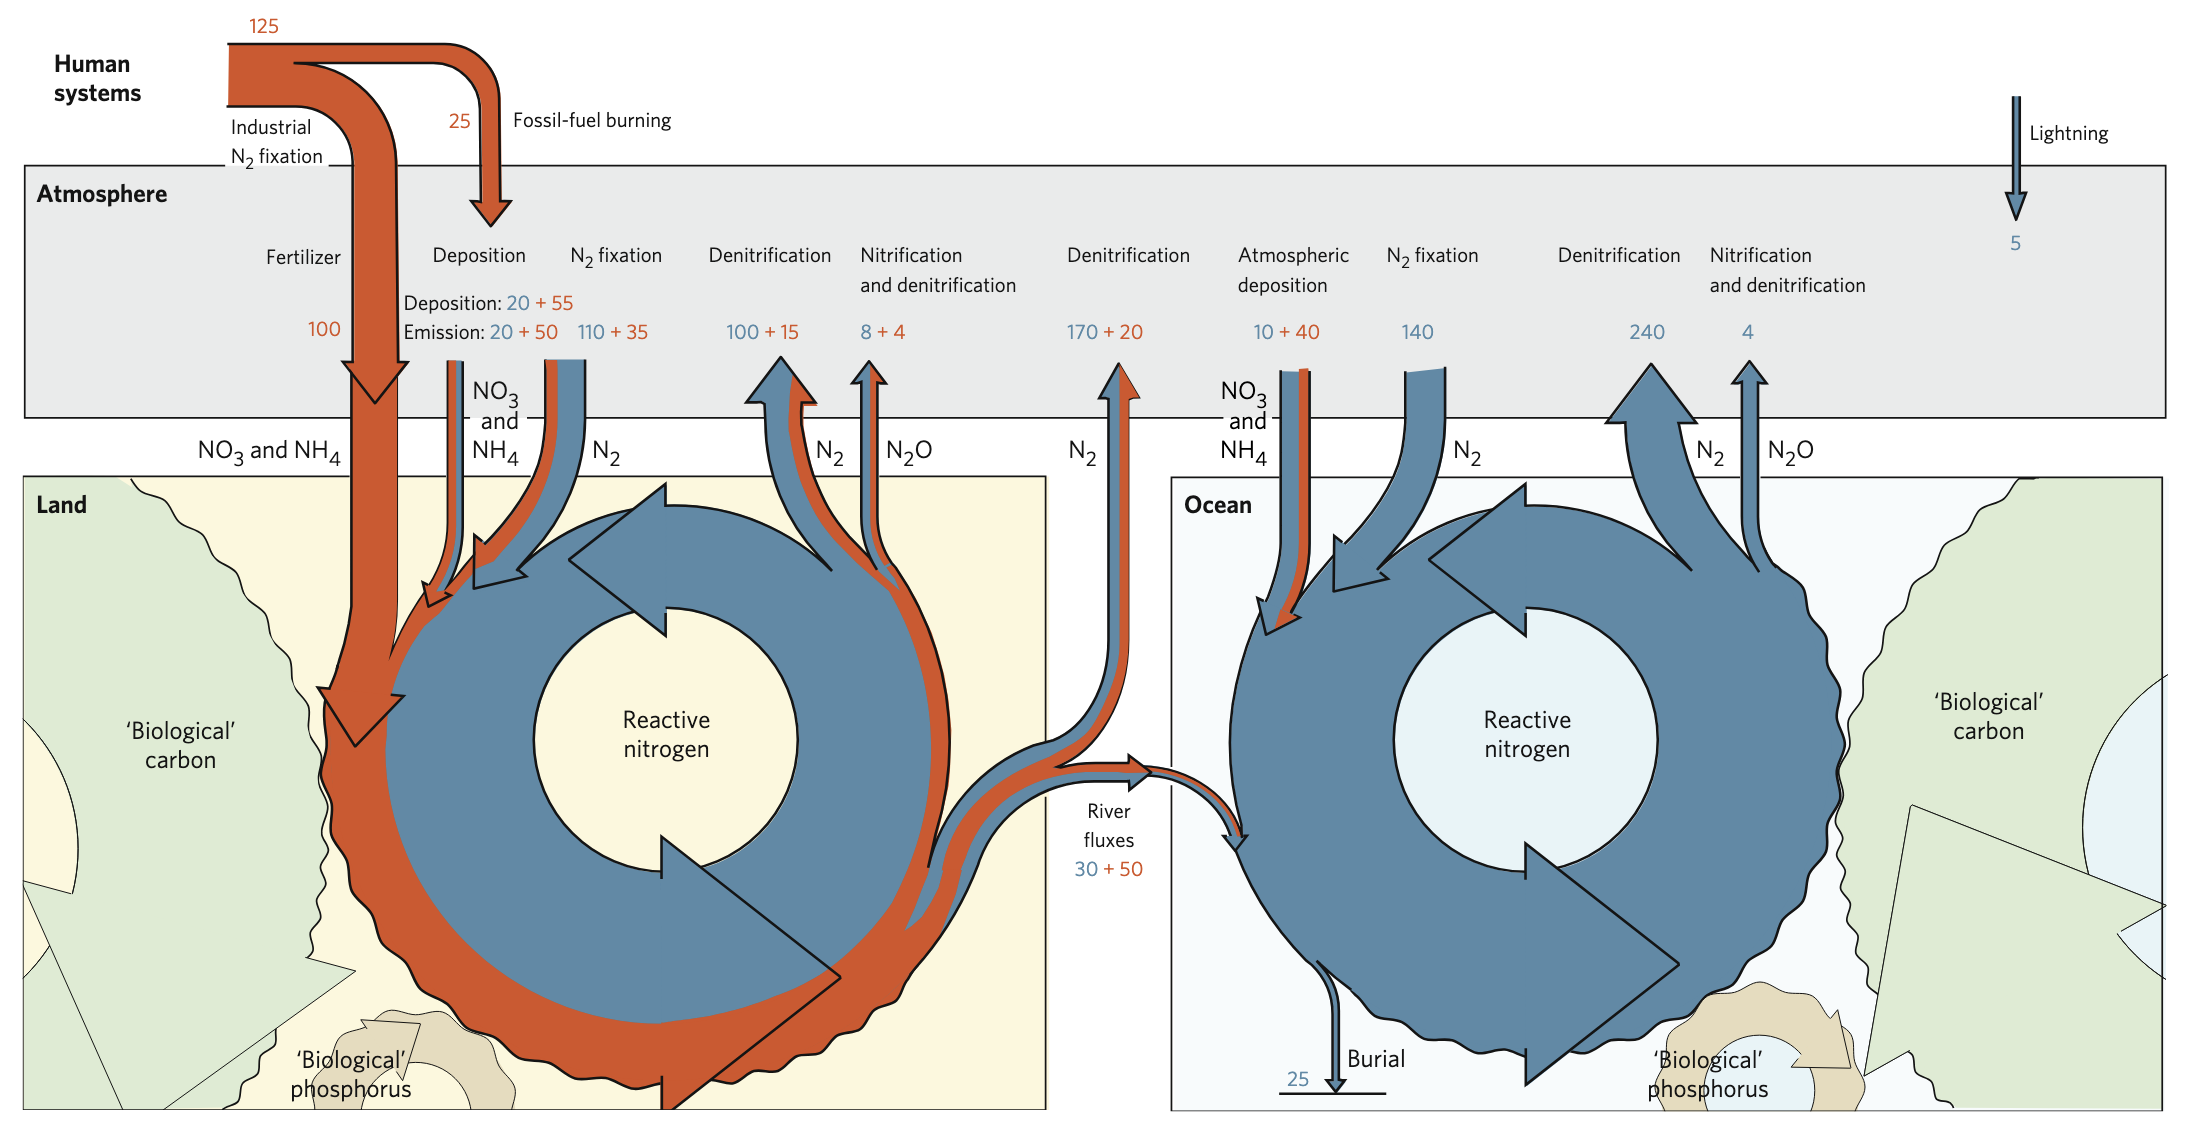
Natural fixation and N2 losses are among the least certain terms. Estimates of terrestrial fixation range from 195 Tg N yr-1 (100–290) for potential natural vegetation (C. C. Cleveland et al. 1999), through 58 (40–100) for preindustrial conditions (Peter M. Vitousek et al. 2013), to a median of 88 (52–130) from field-data upscaling (Davies-Barnard and Friedlingstein 2020). Losses of Nr from the terrestrial biosphere are on a similar magnitude as inputs, reflecting the relatively small storage and fast turnover time of reactive N in terrestrial ecosystems. Yet, a small imbalance may rapidly lead to a large accumulation (or depletion). However, these fluxes are difficult to quantify and global N budget remains poorly constrained. For comparison with the continental upper bound above, Galloway et al. (2004) estimated early-1990s denitrification at about 67 Tg N yr-1 in soils and 48 in the stream–river system. Their marine losses were also substantially higher than the later inverse estimate, illustrating the difficulty of closing global budgets.
Atmospheric transport and deposition redistributes N from lightning, soil emissions, and biomass burning. However, it should be noted that atmospheric deposition does not add newly fixed N, but rather redistributes N that was previously lost through gaseous pathways from land and ocean, or from biomass burning, which primarily mobilises N already present in biomass. Weathering likewise releases stored N, much of it fixed by ancient organisms and buried in sedimentary rocks. Houlton, Morford, and Dahlgren (2018a) distinguished chemical release of 11–18 Tg N yr-1 from total mobilisation of 19–31 Tg N yr-1 including physical erosion. Eroded rock N is not necessarily immediately available to organisms.
11.1.3 Nitrogen cycle in Earth’s history
Biological N2 fixation established at least 3.2 billion years ago and supplied reactive N for biomass production beyond abiotic inputs (Stüeken et al. 2015). In an initially oxygen-poor atmosphere and ocean, much N cycling involved reduced forms. Oxygenic photosynthesis and the rise of atmospheric oxygen, especially around the Great Oxidation Event, approximately 2.4 billion years ago, expanded nitrification and nitrate-based metabolisms. These developments connected fixation to additional pathways of N loss (Canfield, Glazer, and Falkowski 2010a).
Early terrestrial microbial mats probably combined fixation, photosynthesis, and nutrient recycling, supporting organic matter accumulation on land (Lenton and Daines 2017), but at a much reduced rate compared to the “modern” terrestrial C cycle that established with the advent of land plants around 500 mio. years ago. Over geological time, organic burial and subduction transfer N into the solid Earth, while weathering, metamorphism, and degassing return some of it. The modern N cycle is thus a product of coupled biological and geological evolution, with rapid recycling of N through the interplay of plants and microbes (Section 11.2), embedded in much slower exchanges among the atmosphere, ocean, crust, and mantle (Canfield, Glazer, and Falkowski 2010a; Johnson and Goldblatt 2015).
11.2 N cycling in terrestrial ecosystems
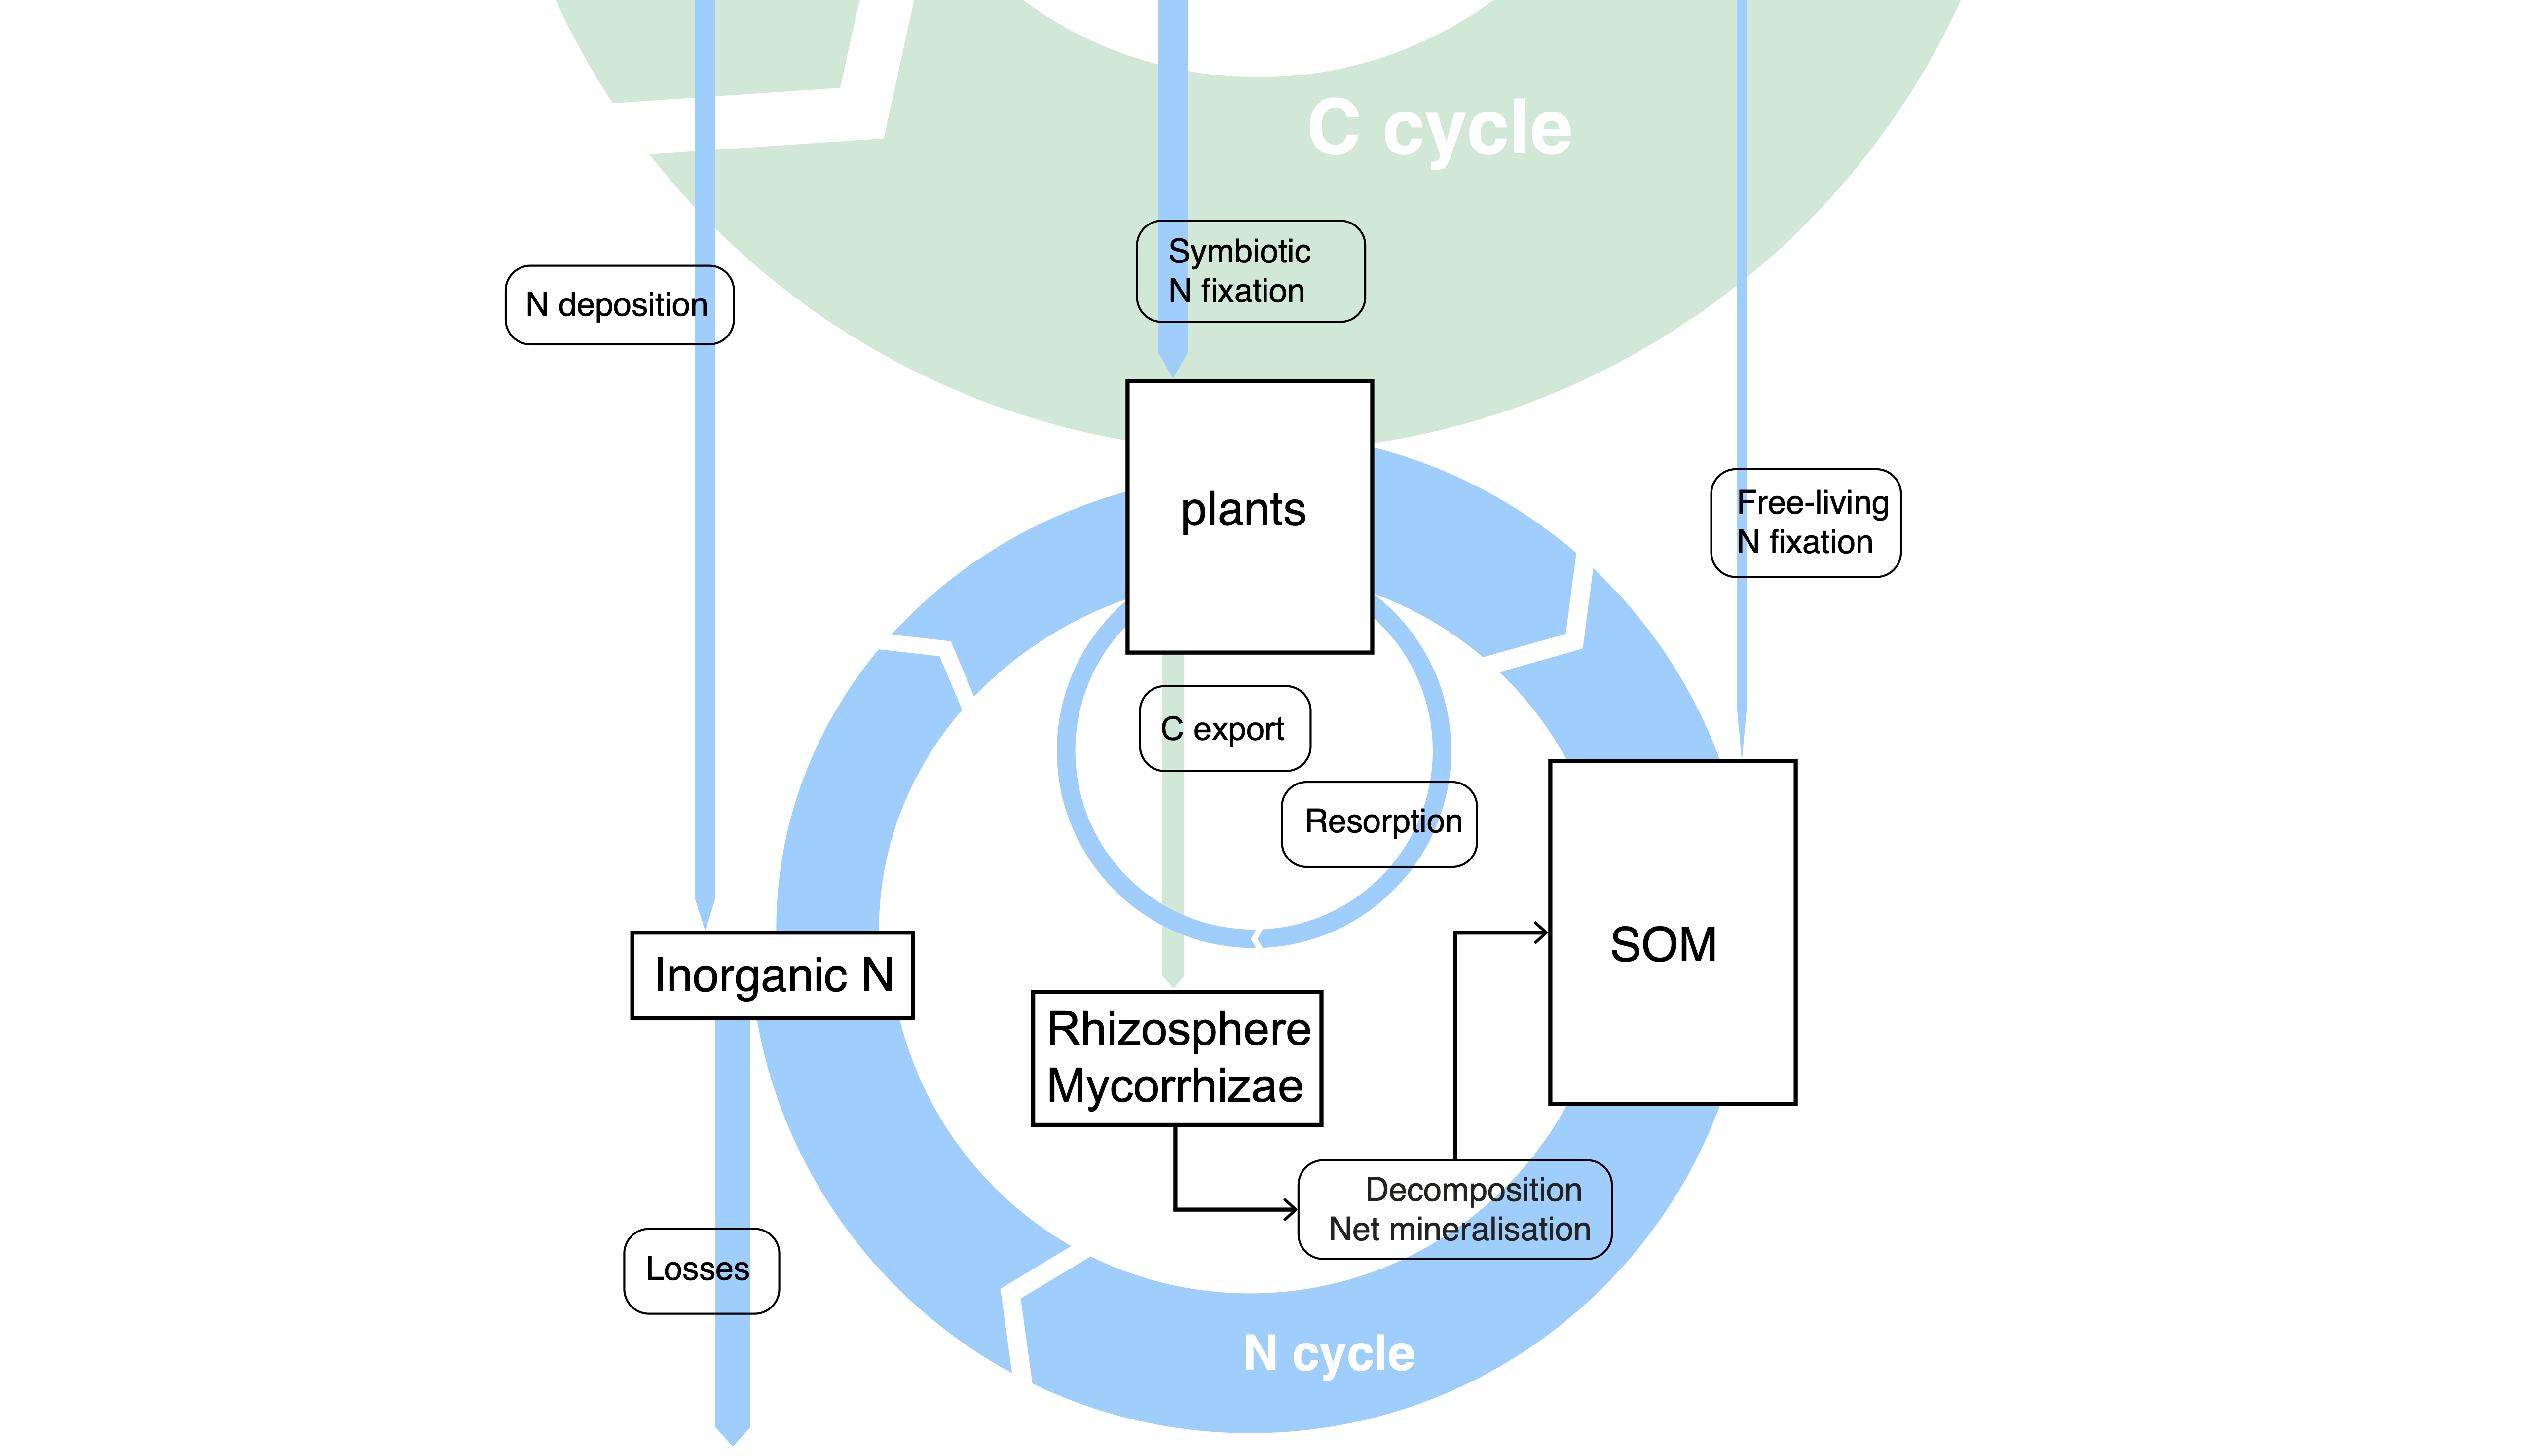
Within terrestrial ecosystems, N moves with biomass production, turnover, litter production, and decomposition. Unlike the large return of assimilated C to the atmosphere through respiration, most of the N required for terrestrial primary production is recycled. Only a smaller fraction is lost through gaseous and hydrological pathways. Unless an ecosystem is accumulating or depleting N, these losses balance external inputs, principally through fixation and deposition.
Two ecosystem N recycling levles can be distinguished (Figure 11.2). Plants recover N from senescing tissues, store it, and reallocate it to new growth. At the ecosystem scale, decomposers release N from organic matter, and plants re-acquire part of the inorganic N remaining after microbial immobilisation. This second route is associated with net mineralisation (Section 11.2.3).
In this section, all components illustrated in Figure 11.2 are briefly explained.
11.2.1 Nitrogen demand and tissue stoichiometry
Biomass production requires N in proportion to tissue composition. Here C:N denotes a mass ratio, in g C per g N. The plant N uptake (\(U_N\)), that is the acquisition from outside the plant, can be estimated from the sum biomass production in different plant compartments (\(P_i\)) with C:N ratio \(R_i\):
\[ U_N = \sum_i \frac{P_i}{R_i} - F_{\mathrm{resorb}}, \tag{11.1}\]
assuming negligible net change in plant-internal N stores. \(F_{\mathrm{resorb}}\) is N recovered (resorbed) from senescing tissues (see Section 11.2.2). With production in g C m-2 yr-1, \(U_N\) is in g N m-2 yr-1 and includes soil uptake and supply from biological N fixation. At fixed total production, allocating more C to N-rich tissues (e.g. foliage) requires more N than allocating it to N-poor tissues (e.g. wood). Globally, annual plant N uptake has been estimated at about 950 Tg N yr-1 (Peng et al. 2023), far above new natural inputs because the same N is repeatedly used.
Table 11.3 and Figure 11.3 show systematic differences among compartments alongside substantial variation within them. Wood and coarse roots contain less N per unit C than foliage and fine roots. Microbial biomass has lower C:N than most plant substrates, creating a demand for additional N during decomposition (Section 11.2.3).
| Compartment | Median | 25th-75th percentile | 5th-95th percentile | \(n\) | Source |
|---|---|---|---|---|---|
| Green leaves | 24.3 | 19.5–32.0 | 14.5–46.7 | 171 | (Vergutz et al. 2012a) |
| Senesced leaves | 44.6 | 34.7–63.2 | 25.0–96.8 | 171 | (Vergutz et al. 2012a) |
| Fine roots | 40.5 | 28.7–56.1 | 19.8–91.0 | 2,976 | (Nikitin et al. 2026) |
| Coarse roots | 93.8 | 61.8–134.5 | 29.1–225.2 | 494 | (Nikitin et al. 2026) |
| Wood | 201.4 | 130.5–307.7 | 71.1–495.4 | 82 | (Wijas et al. 2024, 2025) |
| Leaf litter | 31.3 | 20.3–58.6 | 14.5–97.5 | 381 | (Harmon 2016) |
| Fine-root litter | 41.7 | 33.3–53.6 | 24.6–66.8 | 148 | (Harmon 2016) |
| Bulk SOM (0–30 cm) | 12.6 | 10.0–17.2 | 6.8–36.7 | 78,408 | (Calisto, de Sousa, and Batjes 2023; Niels H. Batjes, Calisto, and de Sousa 2024) |
| Microbial biomass | 6.4 | 5.1–8.6 | 2.3–13.5 | 1,225 | (X. Xu, Thornton, and Post 2014) |
| Fungi | 11.7 | 9.5–14.5 | 5.9–37.2 | 252 | (Zhang and Elser 2017) |
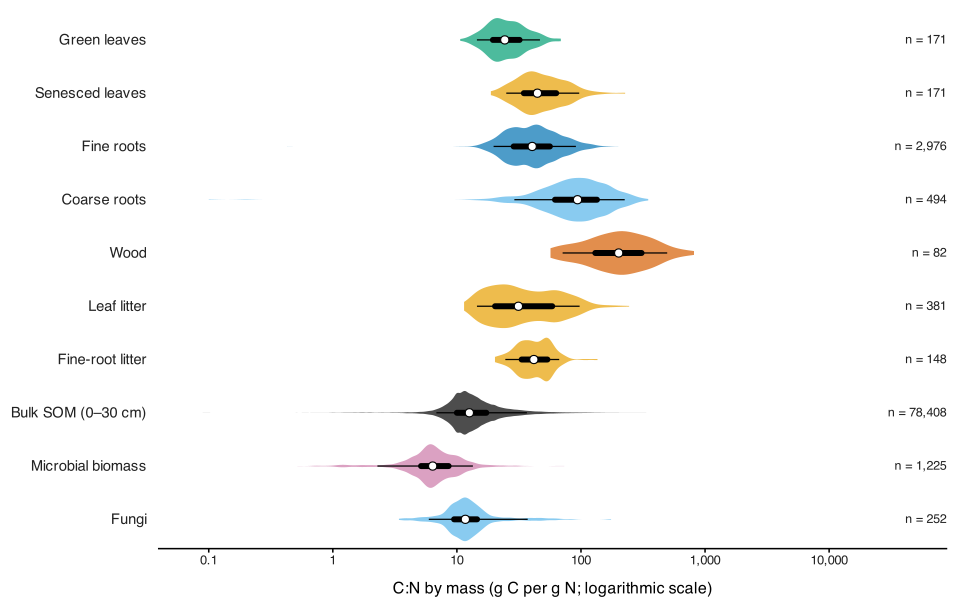
The leaf subset comprises 171 records with measured C and N in both green and senesced leaves, from 13 studies. FRED 4 roots were explicitly classified as living fine or coarse roots; mixed classes, flagged duplicates, and identified non-control treatments were excluded. Ratios use paired concentrations where available, otherwise reported mass C:N.
Wood samples represent two stem sizes from 22 species in one temperate forest near Sydney (Wijas et al. 2025). LIDET follows identified leaf and fine-root litter through up to nine years of decomposition. WoSIS pairs organic C and total N in horizons wholly within 0–30 cm, including organic surface horizons: 78,408 horizons from 53,352 profiles in 154 countries. This approximates SOM C:N without isolating organic N or SOM fractions.
Microbial and fungal molar ratios were converted to mass ratios using \(12/14\) (X. Xu, Thornton, and Post 2013; Zhang and Elser 2017). Fungal values are species means, often based on fruiting bodies; some assume 44% C where C measurements were unavailable. They do not specifically describe soil mycelium. Positive ratios were retained, including unusual archive values that may reflect errors or ecological variation. Reproduction scripts and full selection notes are in analysis/prepare_nitrogen_cn.R, analysis/plot_nitrogen_cn.R, and data/nitrogen_cn/.
Additional distinctions matter within the soil. Bacterial biomass commonly has mass C:N around 4–6 (Strickland and Rousk 2010). Particulate organic matter retains more plant-residue characteristics, whereas mineral-associated organic matter contains more microbial products. Literature ranges of approximately 10–40 and 8–13, respectively, illustrate this contrast (Lavallee, Soong, and Cotrufo 2020).
Leaf N supports metabolic, structural, and storage functions. The amount of N invested in metabolic function is primarily in N-rich Rubisco, but also in the machinery required for electron transport and light harvesting (C. Xu et al. 2012). The amount of N invested in Rubisco is directly linked to maximum carboxylation capacity, \(V_{\mathrm{cmax}}\), at a given temperature and activation state (Chapter 4).
11.2.2 Turnover and resorption
Leaf and root turnover, branch shedding, and plant mortality transfer N to litter. Before leaf abscission, plants degrade proteins and retranslocate N to growing tissues or stores. Resorption efficiency, the fraction of initial leaf N recovered, averages about 62% globally after accounting for mass loss during senescence (Vergutz et al. 2012b). Resorption remains incomplete, and premature leaf loss through drought, frost, or herbivory can interrupt it. Whole-plant mortality bypasses much of this controlled recycling.
For a leaf cohort, with resorbed N fraction \(r_N\) and fraction \(f_C\) of initial leaf C retained in litter,
\[ R_{\mathrm{litter}} = R_{\mathrm{green}}\frac{f_C}{1-r_N}. \tag{11.2}\]
For example, green-leaf C:N = 25, \(r_N=0.60\), and \(f_C=0.80\) give litter C:N = 50. Resorption conserves plant N but leaves N-poorer substrates for decomposers. Long leaf lifespan also conserves N by reducing annual replacement of a standing canopy, although its benefits depend on leaf construction costs and C returns.
11.2.3 Mineralisation
Decomposing organisms (microbes and fungi) obtain energy and nutrients from organic matter. Gross mineralisation releases inorganic N from organic compounds and depends on the rate at which organic matter decomposes. Gross immobilisation incorporates inorganic N into microbial biomass during their growth and inversely scales with their C:N stoichiometry. Microbial growth rates depend on their carbon use efficiency. The difference between gross mineralisation and immobilisation is the net mineralisation. It determines the rate at which Nr becomes available from the decomposition of organic matter.
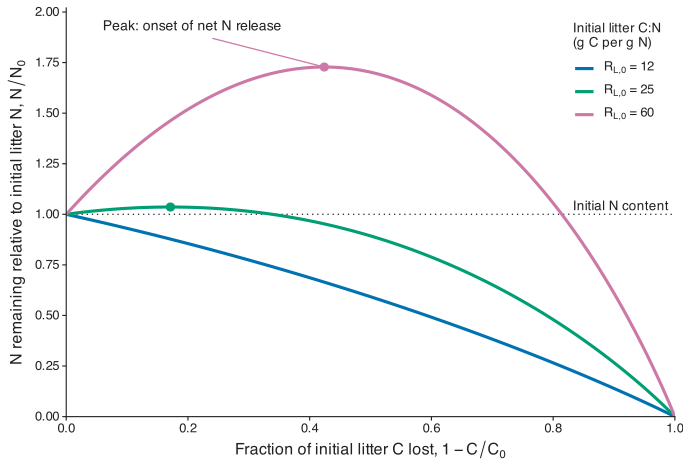
Fresh litter is relatively N-poor and generally has a much higher C:N ratio than microbial biomass (Table 11.3). Hence, N tends to be immobilised upon fresh litter decomposition and associated microbes tend to have a low carbon use efficiency (Manzoni et al. 2008). Mineralisation only yields a net N supply once organic matter is at an advanced state of decay, typically containing microbial necromass, and when its C:N ratio becomes sufficiently low. Microbial turnover and SOM decomposition release previously immobilised N. A litter pool can therefore immobilise N while the combined litter–soil system supplies plant uptake (B. D. Stocker and Prentice 2024). These relations are represented by the N mineralisation model described below and illustrated by Figure 11.4 and Figure 11.5.
A stoichiometric balance explains whether decomposition supplies or consumes mineral N. Let \(D\) be decomposed litter C per unit area and time, \(R_L\) litter C:N, \(R_B\) decomposer C:N, and \(\varepsilon\) microbial carbon-use efficiency. Decomposition supplies \(D/R_L\) N, while producing \(\varepsilon D\) microbial C requires \(\varepsilon D/R_B\) N. Net release is
\[ M_N = D\left(\frac{1}{R_L}-\frac{\varepsilon}{R_B}\right). \tag{11.3}\]
Positive \(M_N\) denotes net mineralisation and negative \(M_N\) net immobilisation. The transition occurs at
\[ R_{L,\mathrm{crit}}=\frac{R_B}{\varepsilon}. \tag{11.4}\]
With \(R_B=8\) and \(\varepsilon=0.4\), the threshold is C:N = 20. Decomposing 100 g C of litter with C:N = 50 supplies 2 g N, but producing 40 g microbial C requires 5 g N. The remaining 3 g N must come from outside that litter pool. If unavailable, growth, efficiency, or substrate use must adjust.
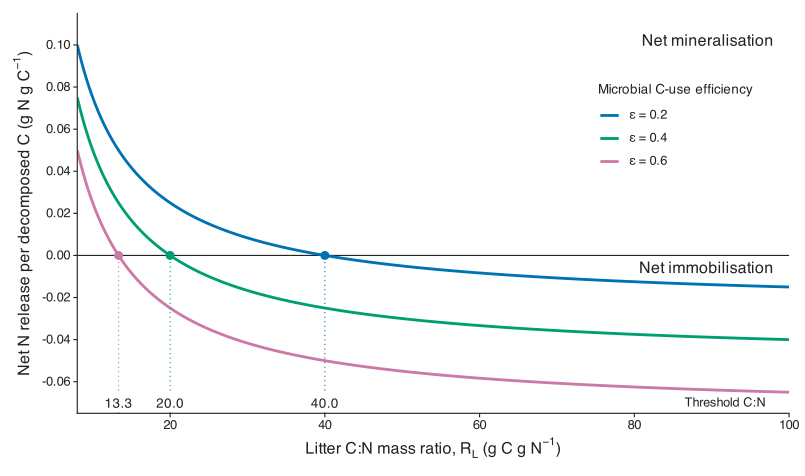
Nutrient-release curves express the delay between C loss and N release (Figure 11.5). N-poor litter may initially accumulate N from its surroundings, then release it as its C:N declines; N-rich litter can release N immediately. Across about 2800 observations, Manzoni et al. (2008) linked these patterns to initial litter chemistry and decomposer stoichiometry. Climate strongly affects how quickly decomposition proceeds, while substrate properties help determine N release relative to C loss. Changes in microbial efficiency mean that the critical C:N is not universal.
11.2.4 Plant uptake
Roots primarily acquire ammonium, nitrate, but also small organic compounds such as amino acids. N uptake happens where N is mineralised from litter and organic matter decay (Section 11.2.3), hence mostly in the top soil. Large organic molecules generally require depolymerisation before uptake, and nitrate must be reduced before incorporation into amino acids (Näsholm, Kielland, and Ganeteg 2009). Plant uptake requires both the flow to an absorbing surface and transport across a membrane. Advection, or mass flow, carries dissolved, mostly inorganic N with water moving towards roots during transpiration. Diffusion supplies N down the concentration gradient generated by uptake. Drying slows diffusion as water-filled pathways become less connected. Ammonium sorption and competition from microbes can further restrict the flow towards absorbing surfaces.
N uptake thus scales with the root surface area per unit soil volume. For a given root mass per soil volume, it is thus advantageous for a plant to “distribute” a given root mass across a large total length of fine roots. This geometric relationship is represented by the root mass and N uptake model in the box below. It explains the tendency for the occurrence of a dense network of very fine roots under nutrient poor conditions.
Following the cylindrical-root framework of McMurtrie and Näsholm (2018), consider roots of uniform radius \(r_0\), with total length \(L\) in a bulk soil volume \(V_s\). Here bulk volume includes the space occupied by roots. Let \(\rho_r\) be root tissue density, expressed as dry mass per unit root volume (kg dry mass m-3 of root). Neglecting root ends, root volume is \(\pi r_0^2L\), surface area is \(2\pi r_0L\), and dry mass is \(M_r=\rho_r\pi r_0^2L\).
The corresponding quantities per unit soil volume are root biomass density \(B_v=M_r/V_s\) (kg dry mass m-3 soil), root length density \(L_v=L/V_s\) (m root m-3 soil), and root surface area density \(A_v=2\pi r_0L/V_s\) (m2 root m-3 soil). They are related by
\[ B_v=\rho_r\pi r_0^2L_v, \qquad A_v=2\pi r_0L_v. \tag{11.5}\]
Solving for length and surface area at a given biomass density gives
\[ L_v=\frac{B_v}{\rho_r\pi r_0^2}, \qquad A_v=\frac{2B_v}{\rho_r r_0}. \tag{11.6}\]
Thus, at fixed biomass and tissue density, root length increases as \(r_0^{-2}\) and surface area as \(r_0^{-1}\). Halving the radius distributes the same biomass into four times as much root length and twice as much absorbing surface. The specific root length, length per unit dry mass, is \(L_v/B_v=1/(\rho_r\pi r_0^2)\); it increases with both decreasing radius and decreasing tissue density.
If \(j_N\) is N influx per unit absorbing surface (g N m-2 root d-1), uptake per unit soil volume is
\[ u_N=A_vj_N =2\pi r_0L_vj_N =\frac{2B_vj_N}{\rho_r r_0}, \qquad \frac{u_N}{B_v}=\frac{2j_N}{\rho_r r_0}. \tag{11.7}\]
At equal influx per surface area, halving root radius therefore doubles uptake per unit biomass. For an illustrative \(B_v=0.1\) kg dry mass m-3 soil and \(\rho_r=100\) kg dry mass m-3 root:
| Root radius | Root length per soil volume | Root surface area per soil volume | Relative uptake at equal \(j_N\) |
|---|---|---|---|
| 1.0 mm | 318 m m-3 | 2 m2 m-3 | 1 |
| 0.2 mm | 7958 m m-3 | 10 m2 m-3 | 5 |
The same root biomass therefore provides 25 times more length and five times more surface when its radius is reduced fivefold. These are geometric calculations, not observed uptake rates.
Longer roots can also explore the soil more closely. If evenly distributed, each root can be assigned a cylindrical domain of radius \(r_x\), with \(\pi r_x^2L_v=1\). Defining the root volume fraction \(\phi=B_v/\rho_r=\pi r_0^2L_v\), the characteristic distance from the domain boundary to the root surface is
\[ \ell=r_x-r_0 =\frac{1}{\sqrt{\pi L_v}}-r_0 =r_0\left(\phi^{-1/2}-1\right). \tag{11.8}\]
At fixed biomass and tissue density, \(\phi\) is constant, so halving root radius also halves this transport distance. Shorter distances facilitate diffusive delivery; mass flow additionally supplies dissolved N with water moving towards roots. Actual influx \(j_N\) depends on these transport processes, membrane capacity, microbial competition, and replenishment of soil N. Finer roots therefore offer greater uptake capacity per unit biomass, but realised uptake need not increase in direct proportion to surface area when N supply is limiting. Root clustering, maintenance costs, lifespan, and hydraulic constraints further modify the benefit.
Mycorrhizal fungi extend exploration beyond root depletion zones in exchange for plant C. Many ectomycorrhizal fungi can mobilise organic N enzymatically. Arbuscular mycorrhizal fungi mainly obtain mineral nutrients and access organic-source N through interactions with decomposers (Terrer et al. 2016). Root exudates can also stimulate decomposition, termed rhizosphere priming, releasing N but potentially losing soil C as CO2 (Kuzyakov et al. 2019). N supply is thus partly a consequence of how plants allocate C below ground.
11.2.5 Biological nitrogen fixation (BNF)
Biological nitrogen fixation (BNF) in terrestrial ecosystems is carried out by a wide variety of organisms, living either in direct symbiosis with plants or as free-living bacteria. Rhizobial and actinorhizal symbioses are mutualistic root-nodule associations where the plant hosts specialized soil bacteria that convert (fix) atmospheric N2 into reactive N (such as ammonium) in exchange for photosynthetic carbon. This exchange illustrates that the fixation of N consumes energy. For molybdenum nitrogenase, the principal enzyme responsible for BNF, the reaction illustrates the energy requirement:
For the predominant, molybdenum-dependent nitrogenase, the conventional reaction is
\[ \mathrm{N_2 + 8H^+ + 8e^- + 16ATP \longrightarrow 2NH_3 + H_2 + 16ADP + 16P_i}. \tag{11.9}\]
Here, \(P_i\) denotes inorganic phosphate. ATP hydrolysis, the energy source, and the supply of reducing power, the comsumption of free electrons (\(e^{-1}\)) support the conversion. Additional costs include construction and maintenance of nitrogenase, its protection from oxygen, and the acquisition of nutrients required for the construction and maintenance of nitrogenase (mostly phosphorous, sulphur, iron, and molybdenum).
Due to the high energy demand and the construction and maintenance costs, symbiotic BNF is established only in a small subset of all land plants, mostly in legumes. However, a wide diversity of microbes, not all living in symbiosis with plants, carry out BNF (Peter M. Vitousek et al. 2013). Free-living BNF ocurs on the surface of plants, in leaves, in mosses, in decaying litter and dead organic matter, in biological soil crusts and in associations with lichens and mosses. Since plants capable of symbiotic BNF are often absent from the community and even when present, rates of symbiotic BNF may vary strongly. Therefore, free-living BNF can constitute a substantial and often critical ecosystem input of reactive N (Reed, Cleveland, and Townsend 2011). Fixed ammonia is rapidly incorporated into organic compounds or protonated to ammonium.
Fixation also occurs in the ocean, through free-living microorganisms and symbioses, including cyanobacteria associated with phytoplankton. Access to light or organic energy sources, phosphorus and iron supply, temperature, and competition for fixed N control locations of where it occurs. Different diazotrophs protect nitrogenase from oxygen by different spatial or temporal arrangements (Canfield, Glazer, and Falkowski 2010a). Global terrestrial and marine flux estimates are compared in Section 11.1.2.
11.2.6 Atmospheric deposition
Emissions from combustion, soils (Section 11.2.7), ammonia volatisiation in manure, and other biological sources supply atmospheric reactive N as inputs to terrestial and marine ecosystems. Wet deposition removes gases and particles with precipitation. Dry deposition transfers them directly to vegetation, soil, water, and other surfaces without precipitation. Some NH3 is redeposited near its source. Longer-range transport connects emission regions with distant ecosystems. Deposition is therefore a source of N for a receiving ecosystem but not an independent global source of newly fixed N (D. Fowler et al. 2015).
11.2.7 Soil inorganic N dynamics and N losses
Ammonium, nitrate, and smaller quantities of other inorganic N species occur in soil solution. A major source is the microbial breakdown of organic matter, which releases inorganic N through mineralisation (Section 11.2.3). Inputs described above (Section 11.2.5) provide additional substrates. Once in solution, N can be taken up by plants and microbes, retained on soil surfaces, transported with water, or transformed by microorganisms (Figure 11.6). Plant N uptake is discussed in Section 11.2.4.
The prevailing microbial transformations or Nr in the soil depend strongly on oxygen availability. Aerated pores favour nitrification, while oxygen-poor microsites favour denitrification. Both can occur simultaneously. Wetness changes both the connectivity of air-filled pores and the supply of dissolved substrates. Temperature affects microbial activity, but the response remains conditional on oxygen, substrate supply and removal (Butterbach-Bahl et al. 2013).
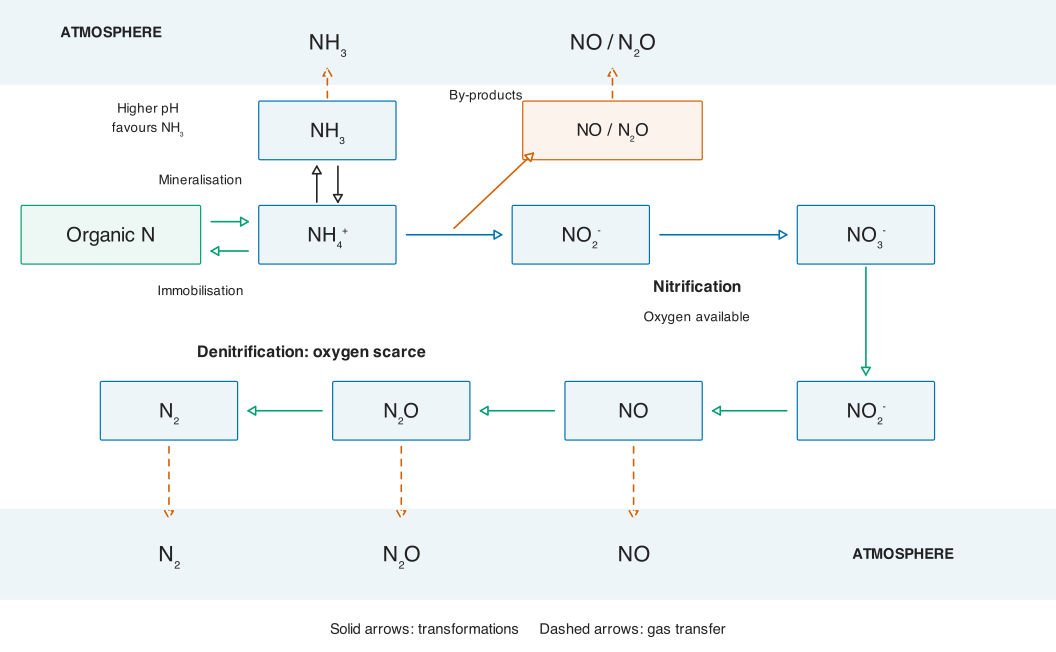
Nitrification is an oxidation process. Ammonia oxidisers and nitrite oxidisers perform its two steps, while some microorganisms carry out complete ammonia oxidation. Its main product, nitrate, remains reactive and available for uptake. Nitrification does not itself return this main flux to N2, but it produces the substrate for denitrification and a mobile form susceptible to leaching. NO and N2O are also formed along ammonia-oxidation pathways.
Denitrification reduces nitrate through NO2-, NO, and N2O to N2, commonly coupled to oxidation of organic substrates when oxygen is scarce. N2O can escape before being further reduced. The return to N2 depends on suitable reactions and organisms: reactive N does not simply revert spontaneously to N2.
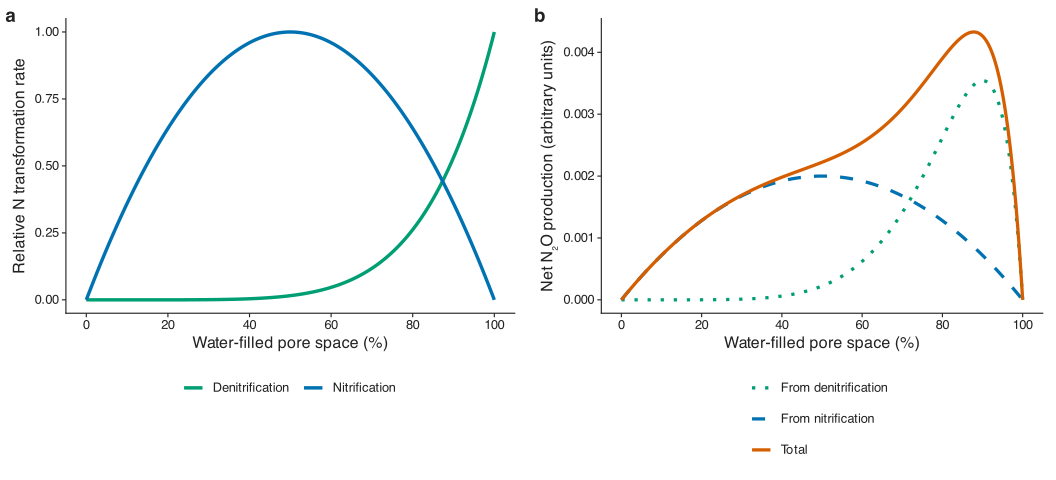
Increasing water-filled pore space generally shifts activity from aerobic towards anaerobic pathways. At very low moisture, restricted microbial activity and solute transport can limit both. At high moisture, denitrification increases, but more complete reduction to N2 can lower the fraction escaping as N2O (Butterbach-Bahl et al. 2013). Consequently, the moisture response of N2O differs from that of total denitrification (Figure 11.7).
Ammonia volatilisation is a further gaseous loss. The equilibrium NH4+ ⇌ NH3 + H+ shifts towards NH3 at higher pH. NH3 is in gaseous form and can escape. Losses through volatilisation can be substantial after manure or urea application.
The principal gases leaving soils through the three processes described above are N2, N2O, NO, and NH3, with proportions that vary among environments. N2 is particularly difficult to measure against its large atmospheric background. The total N loss through gaseous pathways is thus not directly measurable.
Leaching exports dissolved N with drainage below the rooting zone. Nitrate is particularly mobile because it is usually less strongly retained on soil surfaces than ammonium. Losses increase when supply exceeds uptake and microbial retention and when sufficient water drains through the soil. Dissolved organic N also leaves in drainage, while erosion exports particulate N. Transfer downslope constitutes a re-distribution within the catchment and not necessarily an export and a direct loss to the atmosphere. Soils in downslope positions and streams can retain or denitrify incoming N (Seibert, Stendahl, and Sørensen 2007; Lin et al. 2015).
Long-term N fertilisation experiments, carried out across (small) river catchments enable the establishment of the ecosystem N budget, given known and estimated inputs through N deposition and fertilisation, uptake by plants through estimated biomass production and tissue C:N stoichiometries, and leaching losses through measured export of N in streams. The budget residual may represent (unmeasured) gaseous losses. In one such experiment in Alptal, Switzerland, the sustained addition of Nr (22 kg N ha-1 yr-1) for 20 years increased nitrate leaching. Leaching, losses were 6.6–10 kg N ha-1 yr-1 in the treatment versus 1.4–2.9 in the control. Dissolved organic N export averaged 6.1 kg N ha-1 yr-1 and did not respond. Subsequent suppression of tree growth through girdling and felling caused a further amplification of nitrate losses (Schleppi, Curtaz, and Krause 2017). This illustrates the importance of plant productivity for the ecosystem N balance and losses.
N losses through fire and harvest bypass internal recycling. Across long-term fire experiments, frequently burned plots had about 38% less N in the upper 20 cm of soil after 64 years than fire-protected plots, with strong differences among vegetation types (Pellegrini et al. 2018). Harvest removes N that would otherwise partly return through litter. Past inputs also leave legacies: 12–15% of labelled fertiliser N remained in soil organic matter almost three decades after application in one experiment, continuing to supply uptake and leakage (Sebilo et al. 2013).
11.2.8 Ecosystem N balance and openness
For vegetation, litter, microbes, and soil together, external inputs minus losses determine the ecosystem N balance:
\[ \frac{\mathrm{d}N_{\mathrm{eco}}}{\mathrm{d}t} = F_{\mathrm{BNF}}+F_{\mathrm{dep}}+F_{\mathrm{fert}}+F_{\mathrm{weather}} +F_{\mathrm{lateral,in}} -F_{\mathrm{hydro}}-F_{\mathrm{gas}}-F_{\mathrm{harvest}}-F_{\mathrm{fire}}. \tag{11.10}\] Here, \(N_{\mathrm{eco}}\) is the total ecosystem N stock; \(F_{\mathrm{BNF}}\), \(F_{\mathrm{dep}}\), \(F_{\mathrm{fert}}\), \(F_{\mathrm{weather}}\), and \(F_{\mathrm{lateral,in}}\) are N inputs through biological fixation, atmospheric deposition, fertiliser application, release from weathering of N-bearing minerals, and lateral transport, respectively; and \(F_{\mathrm{hydro}}\), \(F_{\mathrm{gas}}\), \(F_{\mathrm{harvest}}\), and \(F_{\mathrm{fire}}\) are N losses through leaching and runoff, gaseous emissions from soil processes, biomass harvesting, and fire, respectively.Gaseous loss excludes separately counted fire emissions. Fertilisation denotes imported mineral or organic N, whereas locally recycled manure is internal at a farm boundary. Uptake, resorption, mineralisation, and immobilisation cancel because they redistribute N within the ecosystem.
The openness of N cycling describes external exchange relative to internal use. With total input \(I_N\), total loss \(L_N\), and plant acquisition \(U_N\) from Equation 11.1,
\[ O_{\mathrm{in}}=\frac{I_N}{U_N},\qquad O_{\mathrm{out}}=\frac{L_N}{U_N}. \tag{11.11}\]
These ratios are equal when the N stock is stationary. Their difference measures net accumulation relative to uptake. Smaller ratios imply more reuse per unit external exchange, but a declining ratio alone does not demonstrate increasing stocks: inputs must actually exceed losses.
A global synthesis estimated about 1197 Tg N yr-1 incorporated into natural terrestrial production, supplied by 371 through resorption, 694 through net mineralisation, and 133 through new inputs (Cory C. Cleveland et al. 2013). Thus, at the global scale, about 89% of the N in new biomass production was estimated to be recycled: 31% within plants and 58% through soil. New inputs represented 11% of tissue demand, or 16% of acquisition after subtracting resorption.
11.2.9 Soil development and nitrogen
The N balance also changes over soil development. Young substrates often contain little organic N, which accumulates gradually through fixation and deposition. Phosphorus is initially supplied by mineral weathering, but prolonged weathering and loss can deplete accessible P or transfer it to less available forms. N limitation is consequently common on young soils and P limitation on old, strongly weathered soils, although rock N, dust, erosion, and disturbance modify this pattern.
Hawaiian fertilisation experiments illustrate the transition: tree growth responded to N on a 300-year-old substrate and to P on a 4.1-million-year-old substrate, with combined nutrient responses at an intermediate age (Peter M. Vitousek and Farrington 1997). Soil history helps explain frequent N limitation in temperate and boreal ecosystems and P limitation in old tropical landscapes. Young tropical soils can be N-limited, old extra-tropical soils P-limited, and co-limitation is common.
11.3 Anthropogenic perturbation
11.3.1 Additional N fixation and Nr inputs
Before synthetic fertiliser, agriculture depended on N inputs from BNF, manure, plant residues, and imported materials such as guano or mined nitrate to compensate for N losses by harvest and export, and leaching, and gaseous losses. At the time, these constraints contributed to concerns about insufficient land productivity and crop yields before the 20th century, failing to keep pace with population growth. The invention of the Haber-Bosch process and the industrial fixation of Nr from atmospheric N2 tapped into the vast atmospheric N reservoir and enabled the fertilisation of crops at unprecedented scale during the twentieth century. Today, the industrial fixation of N is at the same scale (120 Tg N yr-1, Table 11.4) as natural BNF, which illustrates the extent of the anthropogenic N cycle perturbation. The anthropogenic perturbation of the global N cycle is illustrated in Figure 11.1 by the red portion of arrows and circles.
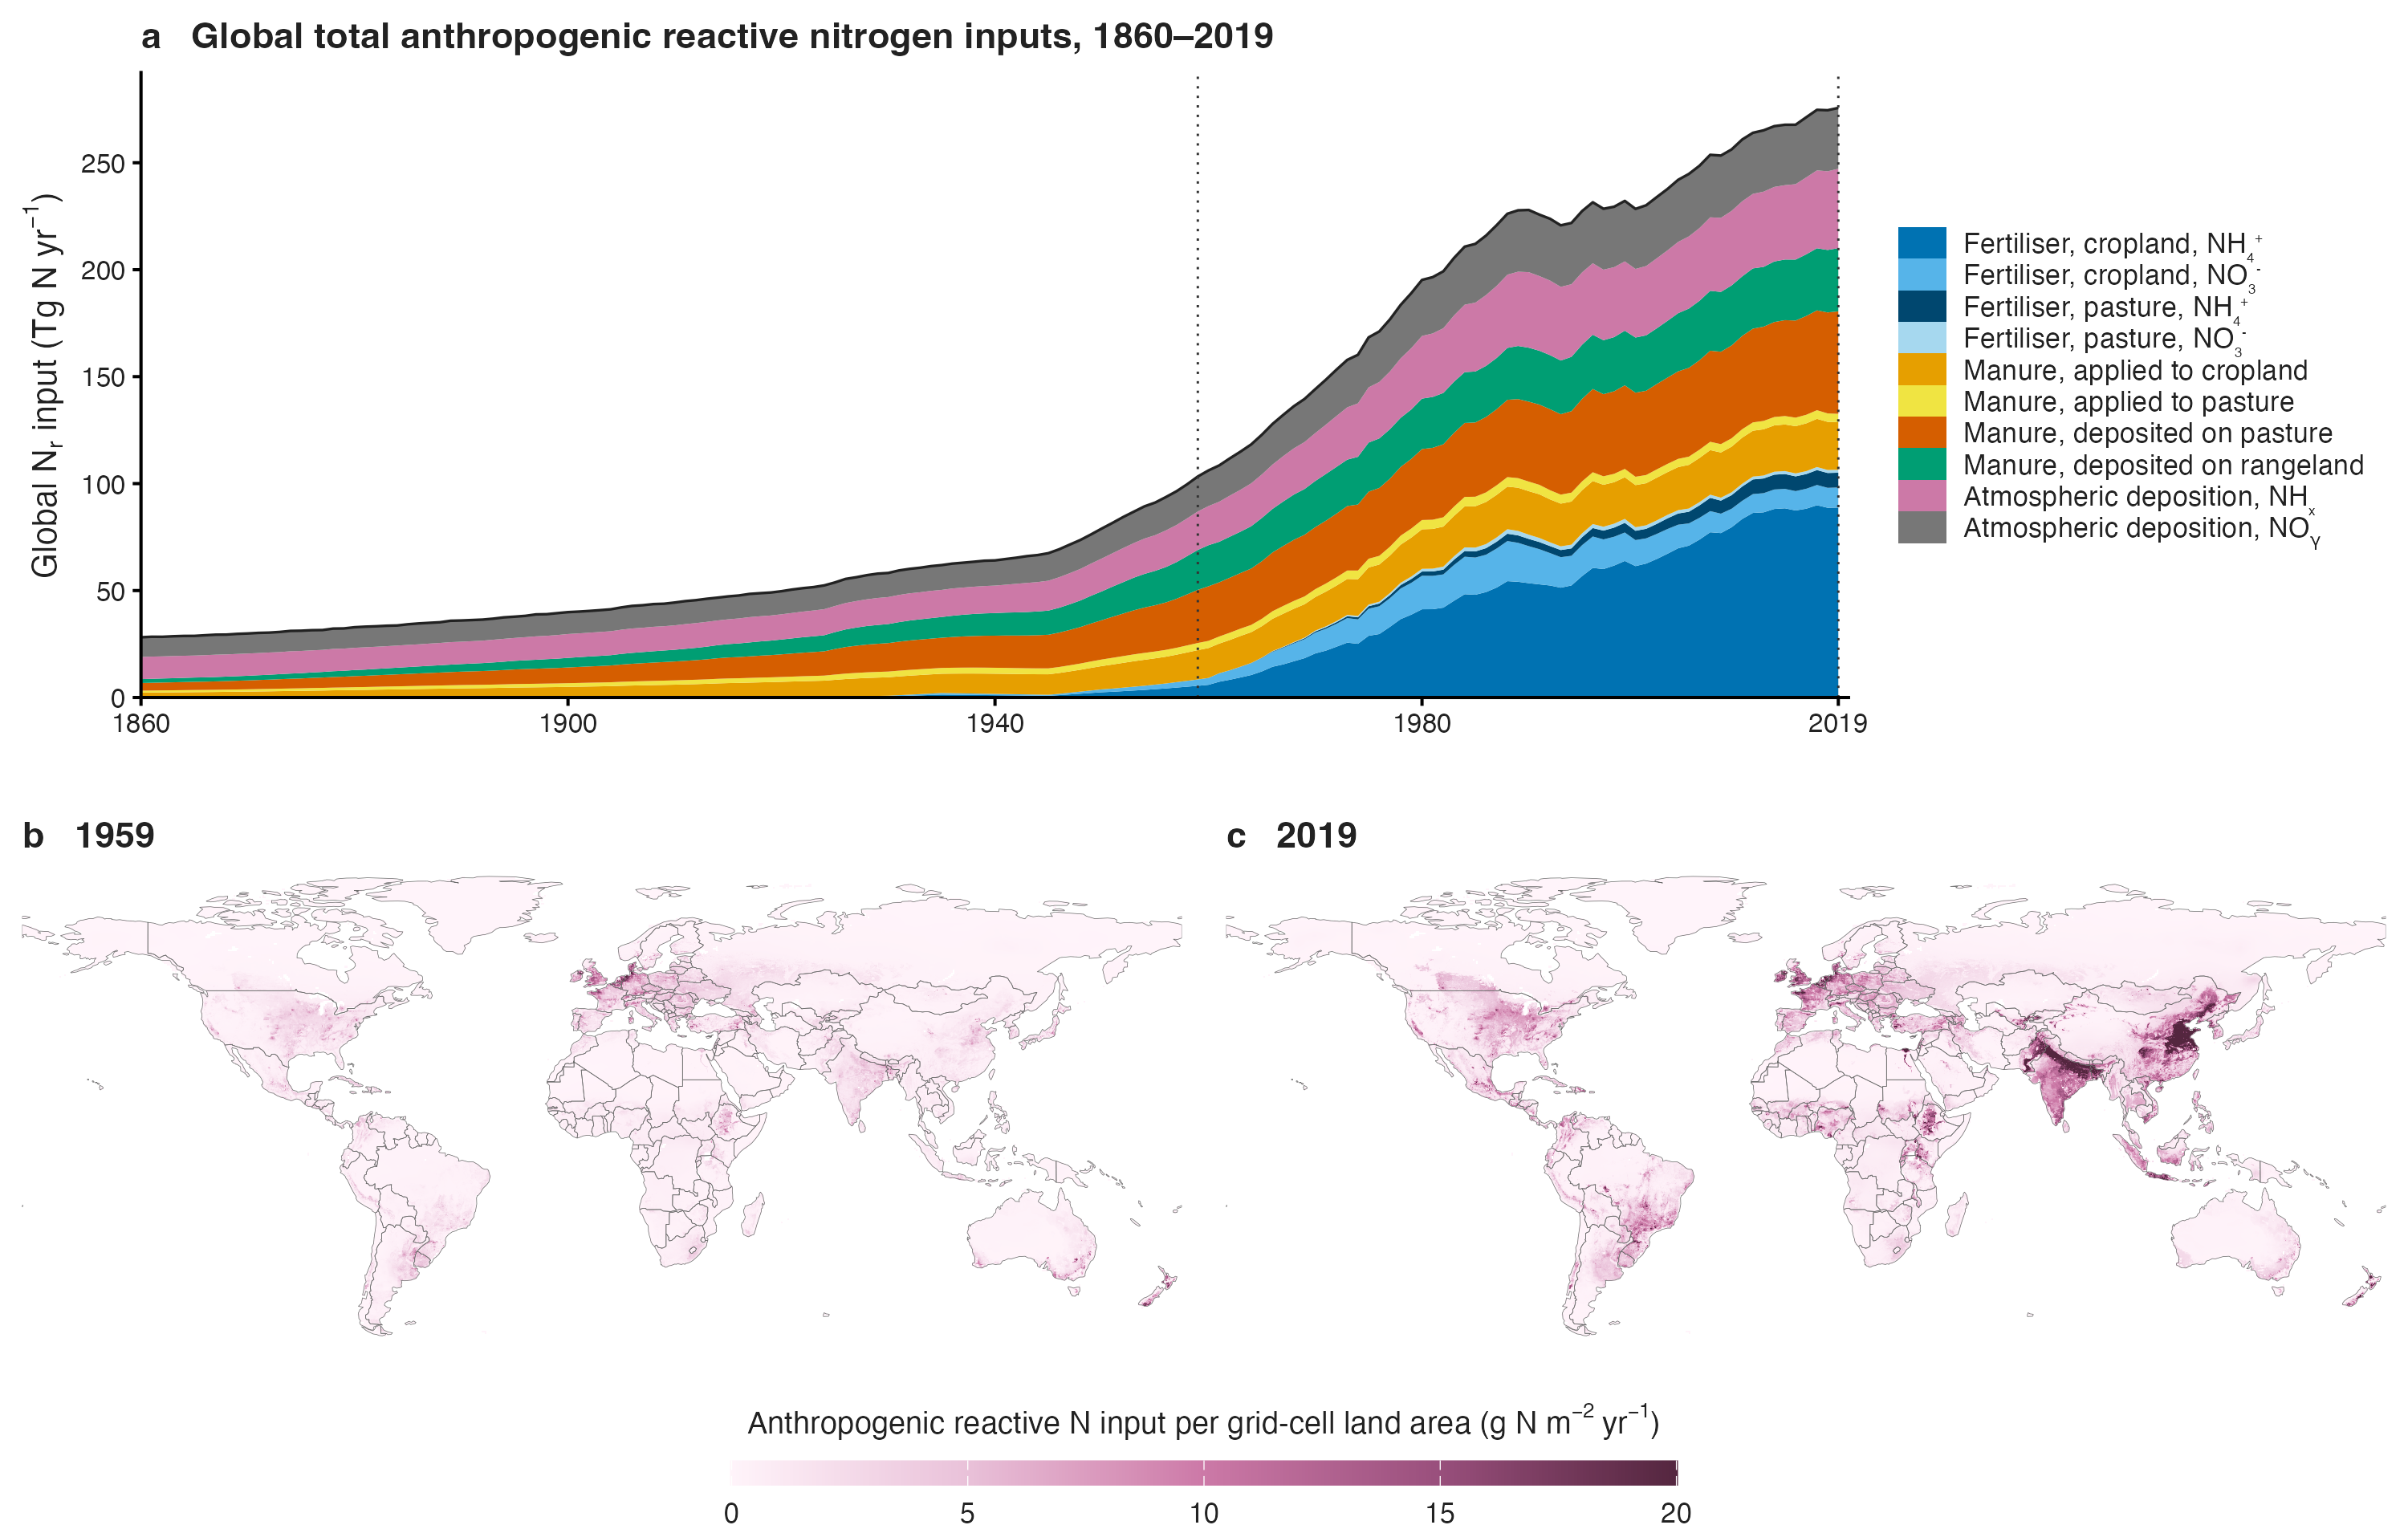
While the production of mineral fertilisers drove an unprecedented land productivity and crop yield growth in many regions (but not everywhere), it also caused environmental impacts by cascading effects of Nr inputs in terrestrial and aquatic ecosystems through a multitude of pathways (Section 11.3.3). The development of Nr inputs through mineral fertilisers on croplands has developed very unevenly across regions globally. While inputs were high in Europe and North America already in around 1959, inputs strongly increased only after that in China and India (Figure 11.8).
Additional BNF by cultivated legumes (Figure 10.2, 60 Tg N yr-1) and Nr production by the combustion of fossil fuels and subsequent deposition (40 Tg N yr-1) provide additional large inputs of Nr in terrestrial ecosystems (Table 11.4).
| Additional source or transfer | Global total (Tg N yr-1) | Interpretation |
|---|---|---|
| Haber–Bosch production | 120 | New Nr prouced is used as fertiliser and other industrial uses |
| Mineral fertiliser N | 100 | This is part of Nr from Haber-Bosch production |
| BNF in crops | 60 | Fixation in agricultural systems, including legumes |
| Manure N applied or deposited by livestock | 100 | Previously fixed N, of which 26 applied to crops and pasture, and 72 deposited during grazing (Tian et al. 2022b) |
| Combustion-related Nr supply | 40 | Broader combustion category in the later assessment |
The Haber–Bosch process combines N2 and hydrogen to produce ammonia:
\[ \mathrm{N_2 + 3H_2 \rightleftharpoons 2NH_3}. \tag{11.12}\]
A catalyst, elevated temperature, and high pressure enable the reaction. The production of hydrogen (H2) consumes energy. Ammonia (NH3) is commonly converted into fertilisers such as urea and ammonium nitrate.
Cultivating soybean, other grain legumes, and leguminous forages supplies fixed N directly to crops and soils. Manure and urine recycle N previously assimilated from feed. Urinary urea is part of this recycling, while manufactured urea contains N already counted in Haber–Bosch production. Neither manure application nor conversion of ammonia into urea constitutes additional fixation of N. Imported feed or manure nevertheless adds N across a farm or regional boundary.
Fossil-fuel combustion produces NOx through oxidation of atmospheric N2 and of N contained in fuels. Biomass burning mainly redistributes previously fixed N. Combustion emissions, together with ammonia from fertilisers and manure, strengthen deposition far beyond agricultural land. In the Galloway et al. (2004) reconstruction, inorganic deposition to land increased from 17.4 Tg N yr-1 in 1860 to 63.5 in the early 1990s, while river export to coasts rose from 27 to 47.8. These transfers carry the anthropogenic perturbation of the N cycle into unfertilised ecosystems and coastal waters.
11.3.2 N2O emissions
Additional mineral N supplies substrates for nitrification and denitrification. Global model simulations, coordinated within the Nitrous Oxide Model Intercomparison Project (NMIP), suggest that soil N2O emissions increased from 6.3 ± 1.1 Tg N yr-1 in the 1860s to 10.0 ± 2.0 in 2007–2016 (Tian et al. 2019). The full budget, emission factors, and climate effects are discussed in Chapter 12.
11.3.3 Pollution and the nitrogen cascade
Additional N can stimulate plant growth where supply is limiting, but sustained inputs can exceed the amount of N that plants and microbes can retain. This nitrogen saturation increases the the load of Nr, potentially prone to leaching and gaseous loss (Aber et al. 1998). Nitrification generates acidity, and nitrate leaching with calcium, magnesium, and other base cations can drive soil acidification. The ensuing aluminium mobilisation leads to a decline of nutrient availability and soil fertility. Indeed, intensive fertilisation has acidified agricultural soils (Guo et al. 2010).
The nitrogen cascade describes successive effects as an N atom moves between environments before returning to atmospheric N2. Nr inputs with fertilisers may support crop growth, but increasing soil inorganic N is prone to gaseous loss, including ammonia volatilisation, which contributes to aerosol formation, deposition, and subsequent leaching into surface waters. Nitrate contaminates groundwater and supports eutrophication. The decomposition of excess aquatic primary production consumes oxygen and can cause hypoxia. NOx contributes to tropospheric ozone formation, and N2O links the cascade to climate and stratospheric ozone depletion. Hence, a useful input at one location can cause environmental damage downstream or downwind (Galloway et al. 2004; D. Fowler et al. 2015).
11.3.4 Nitrogen transfers through trade
Global excess coexists with insufficient access to mineral N fertiliser in different regions across the globe. Harvest without replenishment depletes soil N availability, making inputs of new Nr necessary to sustain yields. Nr inputs are insufficient in many developing countries, particularly those of sub-Saharan Africa (P. M. Vitousek et al. 2009). Yet, Nr is often applied in excess. Enabling productive cropland cultivation and avoiding environmental damage from excess Nr inputs are complementary challenges (P. M. Vitousek et al. 2009; Mueller et al. 2012).
Food and feed trade separates N uptake and BNF from N-rich manure and sewage production and related Nr inputs to the environment. International trade in N contained in products increased from about 3 Tg N yr-1 in 1961 to 24 in 2010 (Lassaletta et al. 2014). Soybean exports transfer biologically fixed N to importing livestock regions, where much N contained in livestook feed becomes manure. Exporting regions lose harvested N while retaining many production-related impacts. In importing regions, Nr accumulates in the environment, contributing to the N cascade (Section 11.3.3). The net trade in product N therefore shapes a region’s N balance and damage from Nr pollution.
11.4 C–N interactions and terrestrial biosphere models
The terrestrial nitrogen and the carbon cycles are tightly coupled. Their close connection arises from the stoichiometric relationships between C and N, which implies that a certain amount of N is required to synthesise a certain amount of C into biomass. A further connection arises through the positive association of photosynthetic capacity and N content in leaves (Section 11.2.1). Since N is an essential nutrient for plants, its availability poses a constraint on biomass productivity and photosynthesis. N losses are, to a certain extent, unavoidable as the recycling of N from its mobilisation by (net) mineralisation (Section 11.2.3) to renewed plant uptake (Section 11.2.4) is never complete. As long as inorganic N (mostly ammonium and nitrate) is present in the soil and subject to denitrification, nitrification, and leaching (Section 11.2.7), losses persist and have to be compensated by inputs of Nr through (relatively slow) deposition and fixation.
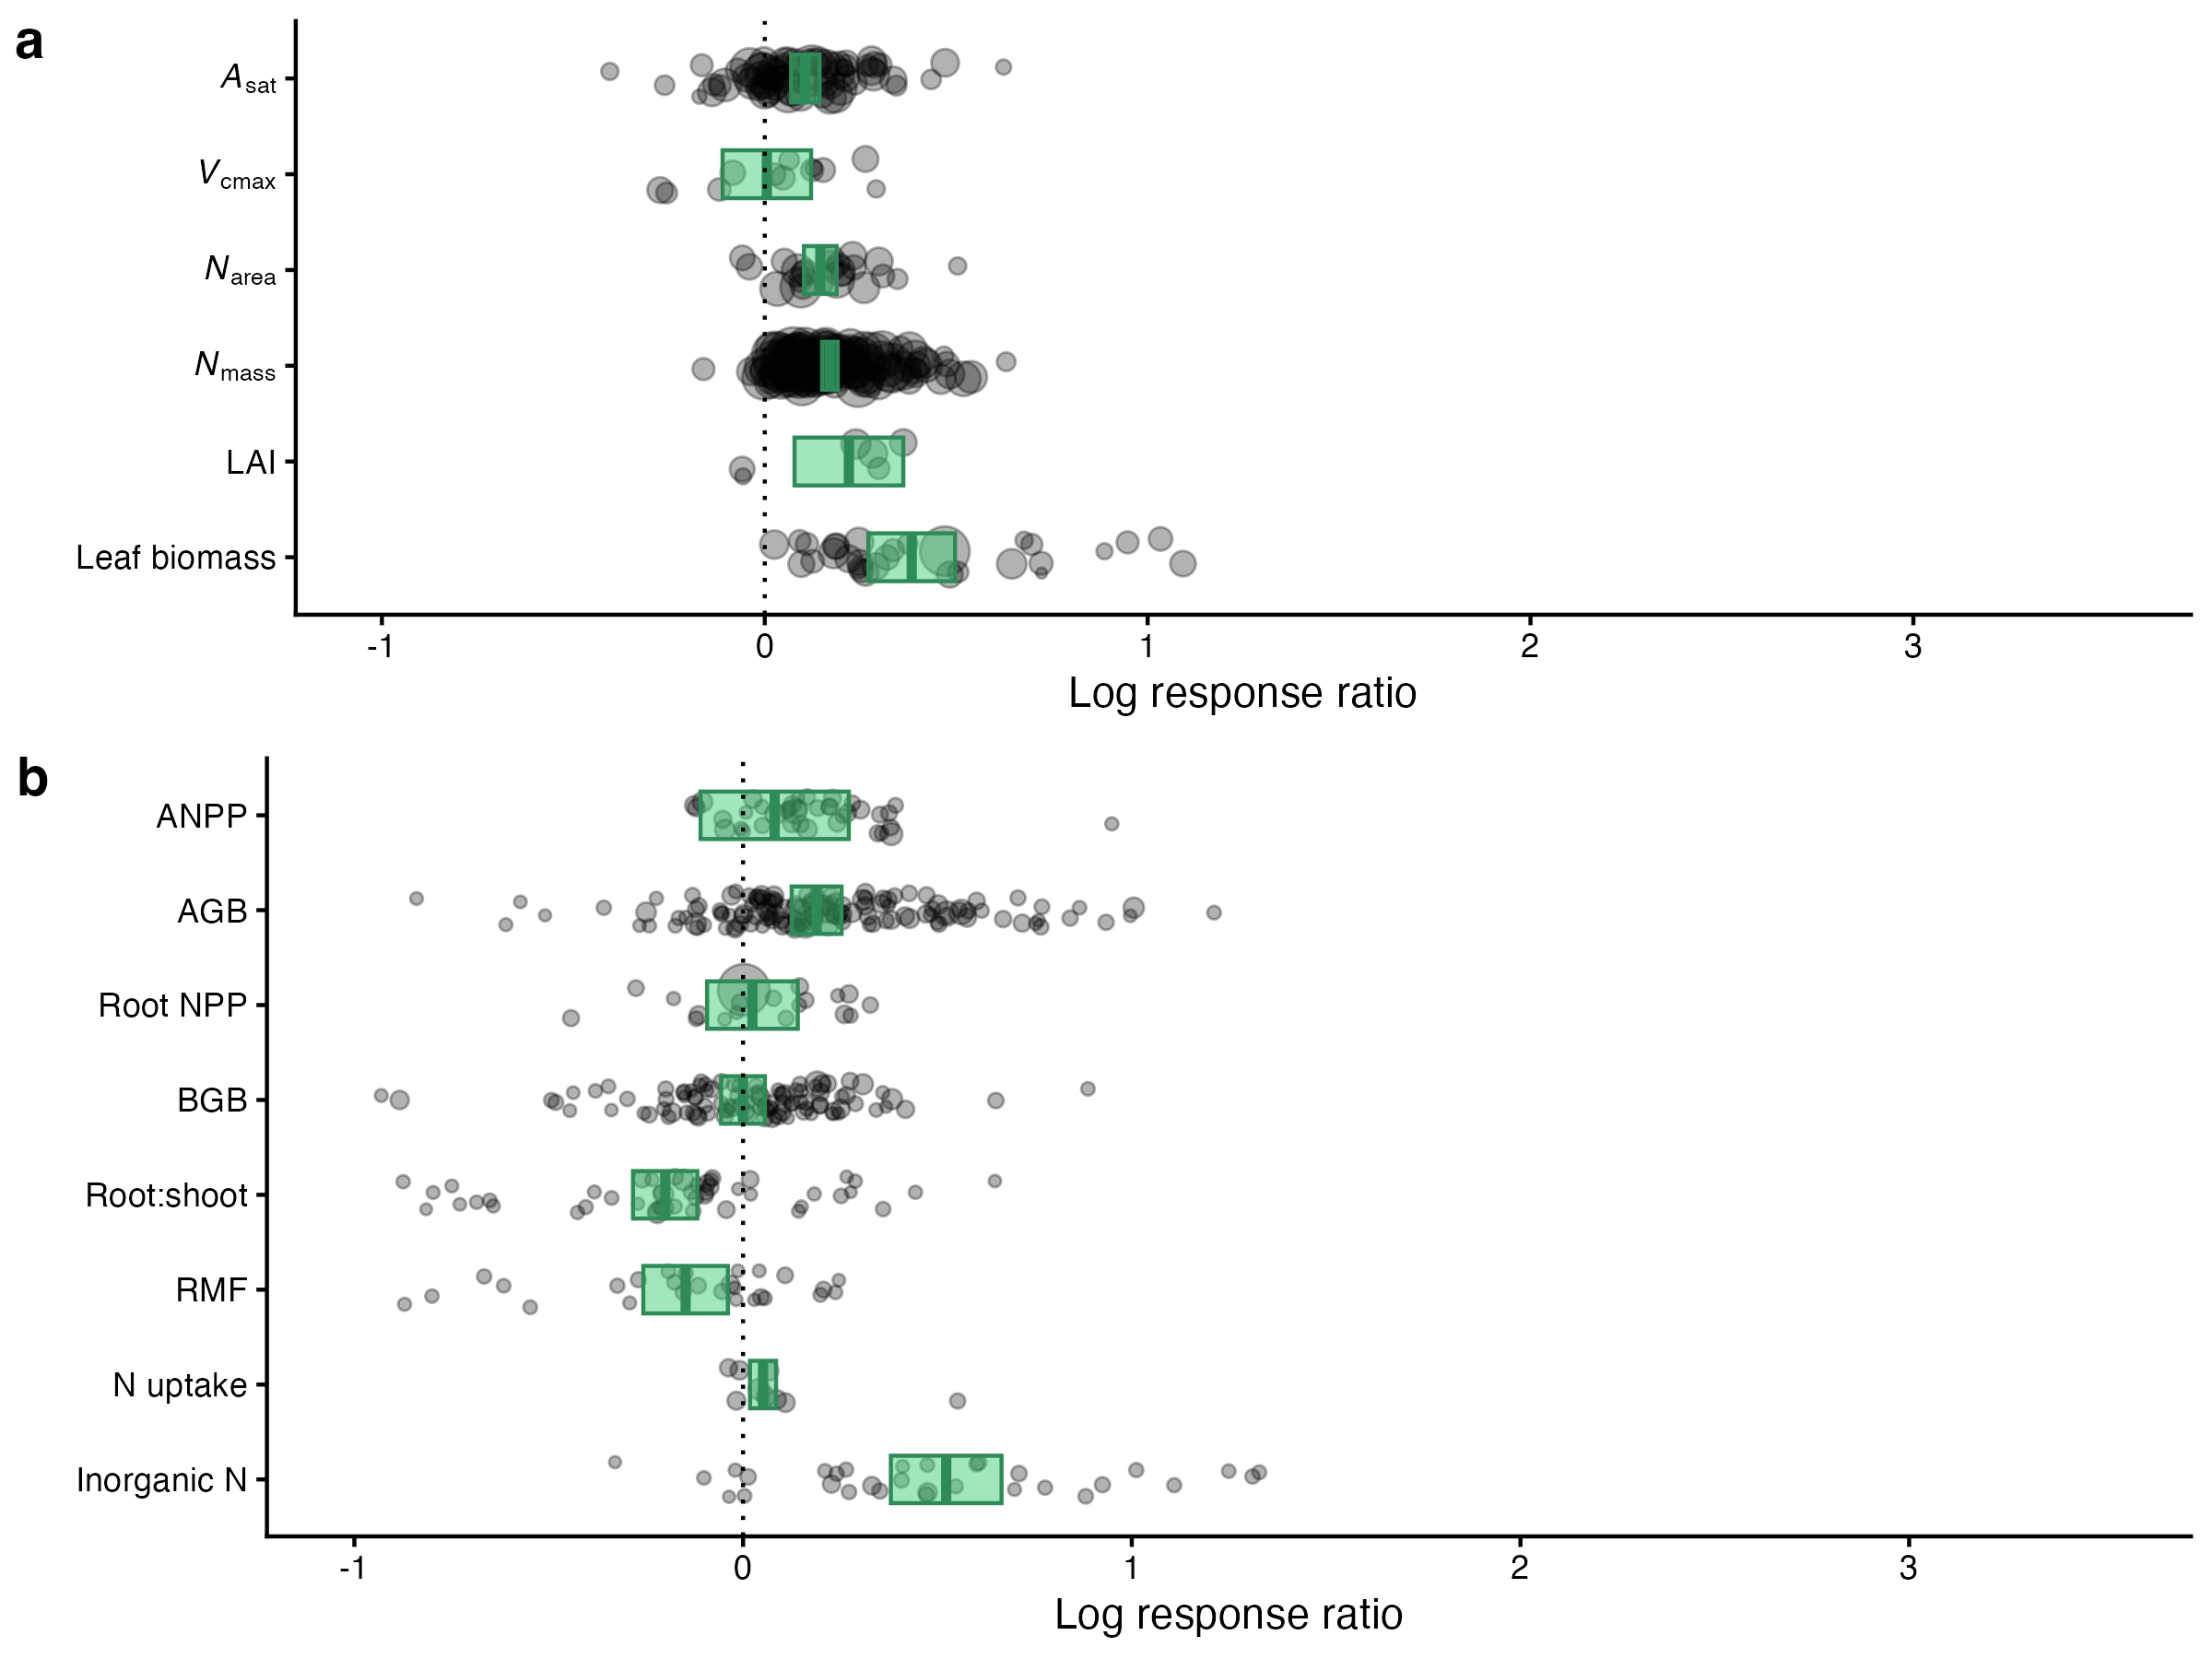
Plants exhibit a certain degree of plasticity in the allocation of C for growth of fine roots, but at the expense of aboveground growth. Under poor nutrient availability, the root-to-shoot ratio and the relative growth in roots vs. aboveground biomass tends to be higher than under N-rich soil conditions (Poorter et al. 2012). Higher root biomass and a denser network of fine roots or the provision of fixed C to mycorrhizal partners can enhance N uptake from the soil (Section 11.2.4) and enables a more efficient recycling of N along the growth-turnover-mineralisation-uptake pathway. However, this comes at the cost of reduced shoot growth and a functional balance between above vs. belowground C allocation for the balancing of CO2 assimilation vs. N uptake establishes (Bloom, Chapin, and Mooney 1985). As a reflection of this, experimental fertilisation of ecosystems with Nr generally triggers a positive response in aboveground growth and leaf area (B. D. Stocker et al. 2025), indicating wide-spread nitrogen limitation (LeBauer and Treseder 2008).
Ecosystem N fertilisation drives changes in vegetation function and structure at all levels – from the leaves to the ecosystem. Leaf N content is enhanced and leaf area and biomass increase clearly (Figure 11.9 a). Also at the ecosystem-level (Figure 11.9 b), ecosystem manipulation experiments indicate a shift towards reduced belowground growth and biomass – a reflection of “cheap” N supply, relieving the requirement for “costly” root construction and maintenance.
Curiously, N limitation persists in many ecosystems despite the potential competitive advantage of N-fixing plant species under such conditions. Why are N-fixing species often not present in established plant communities and why do N-fixing organisms not relieve N limitation? Peter M. Vitousek and Howarth (1991) showed that no single explanation applies everywhere. Fixation has energetic (carbon) costs, depends on suitable organisms and their ecological success, and can itself be limited by P, micronutrients, temperature, or water. Meanwhile, leaching, gaseous losses, fire, and harvest continually remove N. Accumulation in slowly decomposing organic matter can also restrict its immediate availability. N scarcity can thus persist even when N2 is abundant and fixation is possible.
A further expression of the important role of N in controlling the C cycle is the concern about an increasing importance of N limitation in limiting the terrestrial C sink. Rising CO2 generally fertilises photosynthesis and can enhance biomass production and stocks, but sustaining additional C storage requires additional N to be fixed into biomass. The first generation of terrestrial biosphere models and Earth System Models that represented only a C cycle (not not an interacting N cycle) projected a substantial terrestrial C accumulation without explicitly accounting for the potential role of N limitation on the C sink. Hungate et al. (2003) argued that, at assumed tissue and soil C:N ratios, some projections required implausibly large additional N fixation and conservation that are incompatible with empirical estimates of their magnitude and flexibility. This motivated the explicit representation C–N cycle interactions in more recent model generations. However, variable process representations in these models (e.g. stoichiometric flexiblility, plasticity in allocation, response of photosynthesis to N limitation) imply unresolved shortcomings (Medlyn et al. 2015) and diverging simulations of the magnitude and trend in the terrestrial C sink (B. D. Stocker et al. 2025).
- Explain why atmospheric deposition or imported manure can supply a forest or farm without adding a new global fixation flux.
- For litter C:N = 40, decomposer C:N = 8, and carbon-use efficiency 0.3, calculate net N release when 100 g C decomposes. Repeat for efficiency 0.15.
- Assume that a forest under elevated CO2 gains wood C without gaining total ecosystem N. Identify changes in allocation, stoichiometry, or redistribution that could explain this observation.
- Distinguish faster N recycling, lower N-cycle openness, and net N accumulation. Which measurements would establish that each has occurred?